# ruff: noqa%reload_ext autoreload%autoreload 2# Standard libraryimport osimport json# External librariesfrom sklearn.metrics import accuracy_score, f1_score, precision_score, recall_score, cohen_kappa_scorefrom matplotlib import pyplot as pltimport numpy as npimport pandas as pdimport seaborn as snsimport rootutilsimport hydra# Local importsimport ml_project_2_mlp.utils as utils
/Users/jonas-mika/Library/Caches/pypoetry/virtualenvs/ml-project-2-mlp-a6NSXBdT-py3.10/lib/python3.10/site-packages/tqdm/auto.py:21: TqdmWarning: IProgress not found. Please update jupyter and ipywidgets. See https://ipywidgets.readthedocs.io/en/stable/user_install.html
  from .autonotebook import tqdm as notebook_tqdm
# Reinitialize hydra on every runhydra.core.global_hydra.GlobalHydra.instance().clear()h = hydra.initialize(config_path="../conf", job_name="eda", version_base=None)# Setup root environmentroot_path = rootutils.setup_root(".")rootutils.set_root( path=root_path, project_root_env_var=True,)
# Costs per token based on https://openai.com/pricingGPT4_COST_PER_INP_TOKEN =0.00001GPT4_COST_PER_OUT_TOKEN =0.00003GPT3_5_COST_PER_INP_TOKEN =0.000001GPT3_5_COST_PER_OUT_TOKEN =0.000002
def get_num_features(feat, data):returnlen([w[feat] for w in data.values() if w[feat] isnotNoneand w[feat] != []])
Websites
There are three copora of websites in this dataset:
crowdsourced: 761 websites from the crowdsourced dataset from the Homepage2Vec paper
curlie: A filtered version of the curlie dataset, containing ~1M websites
For each website, the repository contains a CSV file at the path data/raw/<corpus>.csv with the two columns - wid and url. The wid is a unique identifier for the website, and the url is the URL of the website.
We will continue by exploring each of our datasets, we will store info about each of the indivudal datasets in a list of dictionaries.
webinfo = []
Crowdsourced Data
This is the annotations crowdsourced for 840 websites in the Homepage2Vec paper.
# Raw datacrowdsourced_data= hydra.utils.instantiate(crowdsourced_cfg.data)raw_data = crowdsourced_data.get_raw_data()processed_data = crowdsourced_data.get_processed_data()embedded_data = crowdsourced_data.get_embeddings()print(f"Total number of samples: {len(raw_data)}")raw_data.head(5)
Total number of samples: 840
wid
url
0
1161124
www.pointlesssites.com
1
1081241
www.connecticutplastics.com
2
1162420
99percentinvisible.org
3
1146040
www.medicaid.gov
4
1117243
www.graalonline.com
# Example of processed websitewid =list(processed_data.keys())[0]data = processed_data[wid]print(f"Collected data on {list(data.keys())}")# Show some examplesprint(f"\nTitle: {data['title']}")print(f"Description: {data['description']}")print(f"Keywords: {data['keywords']}")print(f"Tags: {data['metatags']}")print(f"Domain: {data['domain']}")print(f"TLD: {data['tld']}")
Collected data on ['title', 'description', 'keywords', 'links', 'sentences', 'metatags', 'tld', 'domain']

Title: PointlessSites.com  Fun Things To Do When You're Bored
Description: Are you bored? Want something fun to do? Check out these funny websites, pointless facts and stupid pictures brought to you by Pointless Sites!
Keywords: ['Pointless', 'Sites', 'portal,', 'useless', 'pointlessness']
Tags: ['description', 'viewport', 'author', 'keywords', 'robots', 'copyright']
Domain: pointlesssites
TLD: com
# Setup info dict for originaloriginal_info =dict()# Save these into a dictoriginal_info["n"] =len(processed_data)original_info["tld"] = get_num_features("tld", processed_data) / original_info["n"] *100original_info["domain"] = get_num_features("domain", processed_data) / original_info["n"] *100original_info["tags"] = get_num_features("metatags", processed_data) / original_info["n"] *100original_info["titles"] = get_num_features("title", processed_data) / original_info["n"] *100original_info["descriptions"] = get_num_features("description", processed_data) / original_info["n"] *100original_info["keywords"] = get_num_features("keywords", processed_data) / original_info["n"] *100original_info["links"] = get_num_features("links", processed_data) / original_info["n"] *100original_info["sentences"] = get_num_features("sentences", processed_data) / original_info["n"] *100for k, v in original_info.items():if k !="n":print(f"ℹ️ Percentage of sites with {k}: {v:.2f}%")
ℹ️ Percentage of sites with tld: 100.00%
ℹ️ Percentage of sites with domain: 100.00%
ℹ️ Percentage of sites with tags: 93.69%
ℹ️ Percentage of sites with titles: 98.42%
ℹ️ Percentage of sites with descriptions: 54.93%
ℹ️ Percentage of sites with keywords: 19.58%
ℹ️ Percentage of sites with links: 89.88%
ℹ️ Percentage of sites with sentences: 99.08%
Curlie
This is the random subset of 10,000 websites from the Curlie website index that we wish to re-annotate using GPT labelers.
# Raw datacurlie_data = hydra.utils.instantiate(curlie_cfg.data)raw_data = curlie_data.get_raw_data()processed_data = curlie_data.get_processed_data()embedded_jdata = curlie_data.get_embeddings()print(f"Total number of samples: {len(raw_data)}")raw_data.head(5)
Total number of samples: 10000
wid
url
0
917678
www.winandsoft.fr
1
443072
gaude-ag.de
2
728091
www.housing.ucsb.edu
3
132596
www.daccad.nl
4
464355
www.rockhall.com
# Example of processed websitewid =list(processed_data.keys())[0]data = processed_data[wid]print(f"Collected data on {list(data.keys())}")# Show some examplesprint(f"\nTitle: {data['title']}")print(f"Description: {data['description']}")print(f"Keywords: {data['keywords']}")print(f"Tags: {data['metatags']}")print(f"Domain: {data['domain']}")print(f"TLD: {data['tld']}")
Collected data on ['title', 'description', 'keywords', 'links', 'sentences', 'metatags', 'tld', 'domain']

Title: Logiciel bibliothèque, médiathèque, vidéothèque.
Description: Logiciel bibliothèque  logiciel permettant le catalogage de tous types de documents ou supports pour les besoins d'une bibliothèque. Le logiciel bibliothèque vous garantit la gestion documentaire la plus efficace (livres, cartes, manuscrits, incunables, etc.).
Keywords: ['logiciel', 'bibliotheque,logiciel', 'mediatheque,logiciel', 'gestion', 'bibliotheque,logiciel', 'gestion', 'mediatheque,logiciel,bibliotheque,mediatheque']
Tags: ['description', 'copyright', 'robots', 'keywords', 'author']
Domain: winandsoft
TLD: fr
curlie_info =dict()# Save these into a dictcurlie_info["n"] =len(processed_data)curlie_info["tld"] = get_num_features("tld", processed_data) / curlie_info["n"] *100curlie_info["domain"] = get_num_features("domain", processed_data) / curlie_info["n"] *100curlie_info["tags"] = get_num_features("metatags", processed_data) / curlie_info["n"] *100curlie_info["titles"] = get_num_features("title", processed_data) / curlie_info["n"] *100curlie_info["descriptions"] = get_num_features("description", processed_data) / curlie_info["n"] *100curlie_info["keywords"] = get_num_features("keywords", processed_data) / curlie_info["n"] *100curlie_info["links"] = get_num_features("links", processed_data) / curlie_info["n"] *100curlie_info["sentences"] = get_num_features("sentences", processed_data) / curlie_info["n"] *100for k, v in curlie_info.items():if k !="n":print(f"ℹ️ Percentage of sites with {k}: {v:.2f}%")
ℹ️ Percentage of sites with tld: 100.00%
ℹ️ Percentage of sites with domain: 100.00%
ℹ️ Percentage of sites with tags: 95.47%
ℹ️ Percentage of sites with titles: 98.28%
ℹ️ Percentage of sites with descriptions: 62.95%
ℹ️ Percentage of sites with keywords: 27.29%
ℹ️ Percentage of sites with links: 91.62%
ℹ️ Percentage of sites with sentences: 99.03%
LaTeX Table
# Put the data info into a dataframedf = pd.DataFrame([original_info, curlie_info], index=["Crowdsourced", "Curlie-10k"]).round(2)# Change all columns names to include (%)df.columns = [f"{c} (%)"if c !="n"else c for c in df.columns]df = df.T# Save the dataframe to a latex tableposition ="!ht"latex = df.to_latex( caption="Percentage of websites with each feature accross our datasets.", label="tab:feature-info", escape=True, float_format="%.2f", position=position)# Add \centering right after \begin{table}latex = latex.replace("\\begin{table}"+f"[{position}]", "\\begin{table}"+f"[{position}]"+"\n\\centering")# Save the latex tablesave_path = os.path.join(root_path, "report", "tables", "feature-info.tex")withopen(save_path, "w") as f: f.write(latex)print(f"✅ Saved table to {save_path}")
✅ Saved table to /Users/jonas-mika/epfl/coursework/projects/ml-project-2-mlp/report/tables/feature-info.tex
Labelers
There are multiple GPT labeler instances that can be used to label the data. The labelers are defined in the labelers module and are identified by a context, model and fewshow parameter. The context parameter defines the context that is used to prompt the model. The model parameter defines the model that is used to generate the labels. The fewshot parameter defines whether the model is trained in a few-shot manner or not.
Parameter
Variants
Description
context
context1
Uses the tld, domain and metatags as context
context2
Uses the tld, domain, metatags, links and text as context
context3
Uses the tld, domain, metatags, links, text and images as context
model
gpt3.5
Uses GPT-3.5 (gpt-3.5-turbo-1106)
gpt4
Uses GPT-4 (gpt-4-1106-preview)
fewshot
fewshot
Injects an example website and label into the system prompt
zeroshot
Does not inject any example website or label into the system prompt
We are considering all contexts and few-shot settings for the GPT-3.5 model, but only the context2 for the GPT-4 model. Additionally, we have the human labeler which simply loads the annotatations for the original dataset from the Homepage2Vec paper.
# Initialise configuration for all labelersgpt_labeler_names = ["gpt3.5-zeroshot-context1", "gpt3.5-oneshot-context1","gpt3.5-zeroshot-context2","gpt3.5-oneshot-context2","gpt3.5-zeroshot-context3","gpt3.5-oneshot-context3","gpt4-zeroshot-context1","gpt4-oneshot-context1","gpt4-zeroshot-context2","gpt4-oneshot-context2","gpt4-zeroshot-context3","gpt4-oneshot-context3"] gpt_labelers_cfg = {labeler: hydra.compose(config_name="eda", overrides=[f"labeler={labeler}"]) for labeler in gpt_labeler_names}
# Instantiate labelersgpt_labelers = {labeler: hydra.utils.instantiate(cfg.labeler, data=crowdsourced_data) for labeler, cfg in gpt_labelers_cfg.items()}
# Instatntiate labelers dataframedef get_info(labeler):return {"model": labeler.model,"context": labeler.name.split("-")[-1],"shot": labeler.fewshot, }labeler_info = pd.DataFrame( [get_info(labeler) for labeler in gpt_labelers.values()], index=[get_labeler_name(name) for name in gpt_labelers.keys()])labeler_info
model
context
shot
GPT-3.5 + 0-shot + C1
gpt-3.5-turbo-1106
context1
False
GPT-3.5 + 1-shot + C1
gpt-3.5-turbo-1106
context1
True
GPT-3.5 + 0-shot + C2
gpt-3.5-turbo-1106
context2
False
GPT-3.5 + 1-shot + C2
gpt-3.5-turbo-1106
context2
True
GPT-3.5 + 0-shot + C3
gpt-3.5-turbo-1106
context3
False
GPT-3.5 + 1-shot + C3
gpt-3.5-turbo-1106
context3
True
GPT-4 + 0-shot + C1
gpt-4-1106-preview
context1
False
GPT-4 + 1-shot + C1
gpt-4-1106-preview
context1
True
GPT-4 + 0-shot + C2
gpt-4-1106-preview
context2
False
GPT-4 + 1-shot + C2
gpt-4-1106-preview
context2
True
GPT-4 + 0-shot + C3
gpt-4-1106-preview
context3
False
GPT-4 + 1-shot + C3
gpt-4-1106-preview
context3
True
Let’s verify that the labelers are working as expected by checking the number of labeled webpages.
num_processed_websites =len(crowdsourced_data.get_processed_data())print(f"ℹ️ Number of processed websites: {num_processed_websites}")for name, labeler in gpt_labelers.items(): num_labels =len(labeler.get_labels())print(f"ℹ️ Number of {name} labels: {num_labels}")
ℹ️ Number of processed websites: 761
ℹ️ Number of gpt3.5-zeroshot-context1 labels: 761
ℹ️ Number of gpt3.5-oneshot-context1 labels: 761
ℹ️ Number of gpt3.5-zeroshot-context2 labels: 761
ℹ️ Number of gpt3.5-oneshot-context2 labels: 761
ℹ️ Number of gpt3.5-zeroshot-context3 labels: 761
ℹ️ Number of gpt3.5-oneshot-context3 labels: 761
ℹ️ Number of gpt4-zeroshot-context1 labels: 761
ℹ️ Number of gpt4-oneshot-context1 labels: 761
ℹ️ Number of gpt4-zeroshot-context2 labels: 761
ℹ️ Number of gpt4-oneshot-context2 labels: 761
ℹ️ Number of gpt4-zeroshot-context3 labels: 761
ℹ️ Number of gpt4-oneshot-context3 labels: 761
Labeling statistics
Let’s investigate some statistics about the labelers. We will compute:
The average number of labels per website
The number of valid labels
The number of invalid labels
The average time taken to label a website
The average number of prompt and completion tokens used to label a website
labeler_statistics = pd.DataFrame(
    [get_statistics(labeler) for labeler in gpt_labelers.values()],
    index=[get_labeler_name(name) for name in gpt_labelers.keys()])
labeler_statistics
✅ Plotted figure to /Users/jonas-mika/epfl/coursework/projects/ml-project-2-mlp/data/meta/categories.json
Labeling Quality: Macro F1, Precision, Recall, etc.
The goal of all GPT labelers is to replicate the ground truth labels provide by the human annotators as closely as possible. As we only have human annotations for the crowdsourcede dataset, we can only evaluate the labelers on this dataset.
labeler_perf = pd.DataFrame([get_labeler_perf(labeler) for labeler in gpt_labelers.values()], index=[get_labeler_name(name) for name in gpt_labelers.keys()])labeler_perf
acc
subset_acc
macro_f1
micro_f1
weighted_f1
macro_precision
micro_precision
macro_recall
micro_recall
GPT-3.5 + 0-shot + C1
0.827013
0.085414
0.159570
0.162653
0.155489
0.635233
0.606780
0.097283
0.093914
GPT-3.5 + 1-shot + C1
0.826826
0.091984
0.232630
0.289017
0.277751
0.565566
0.544267
0.161507
0.196747
GPT-3.5 + 0-shot + C2
0.836306
0.139290
0.375855
0.412003
0.411554
0.562262
0.576415
0.297584
0.320567
GPT-3.5 + 1-shot + C2
0.832551
0.127464
0.386863
0.440402
0.440510
0.526652
0.547582
0.320552
0.368311
GPT-3.5 + 0-shot + C3
0.828046
0.128778
0.372394
0.409794
0.410367
0.499444
0.530885
0.314836
0.333683
GPT-3.5 + 1-shot + C3
0.821476
0.115637
0.377024
0.426071
0.428640
0.464730
0.501420
0.328673
0.370409
GPT-4 + 0-shot + C1
0.820537
0.095926
0.355475
0.373115
0.374361
0.474167
0.497378
0.295117
0.298531
GPT-4 + 1-shot + C1
0.808804
0.069645
0.361039
0.381791
0.385413
0.452552
0.452844
0.320988
0.330010
GPT-4 + 0-shot + C2
0.828515
0.115637
0.453939
0.485497
0.490625
0.499528
0.524012
0.429976
0.452256
GPT-4 + 1-shot + C2
0.820255
0.086728
0.459306
0.496450
0.505203
0.484074
0.497628
0.461682
0.495278
GPT-4 + 0-shot + C3
0.820631
0.099869
0.440991
0.477441
0.484140
0.461169
0.498572
0.433199
0.458027
GPT-4 + 1-shot + C3
0.809461
0.077530
0.461246
0.496777
0.509009
0.457310
0.470865
0.492367
0.525708
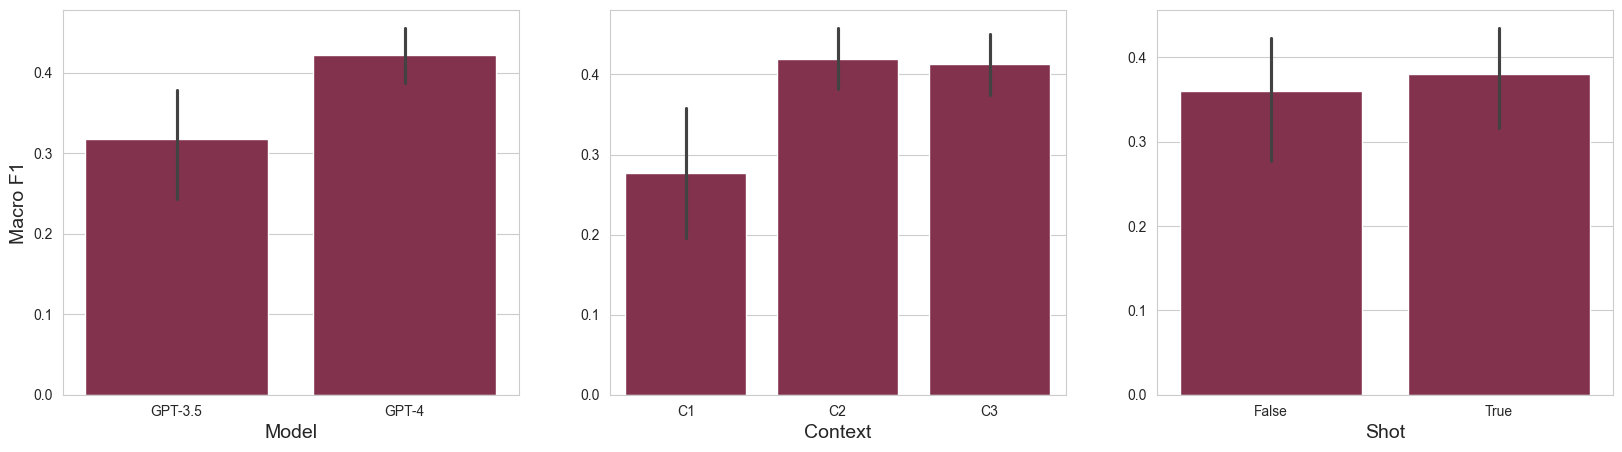
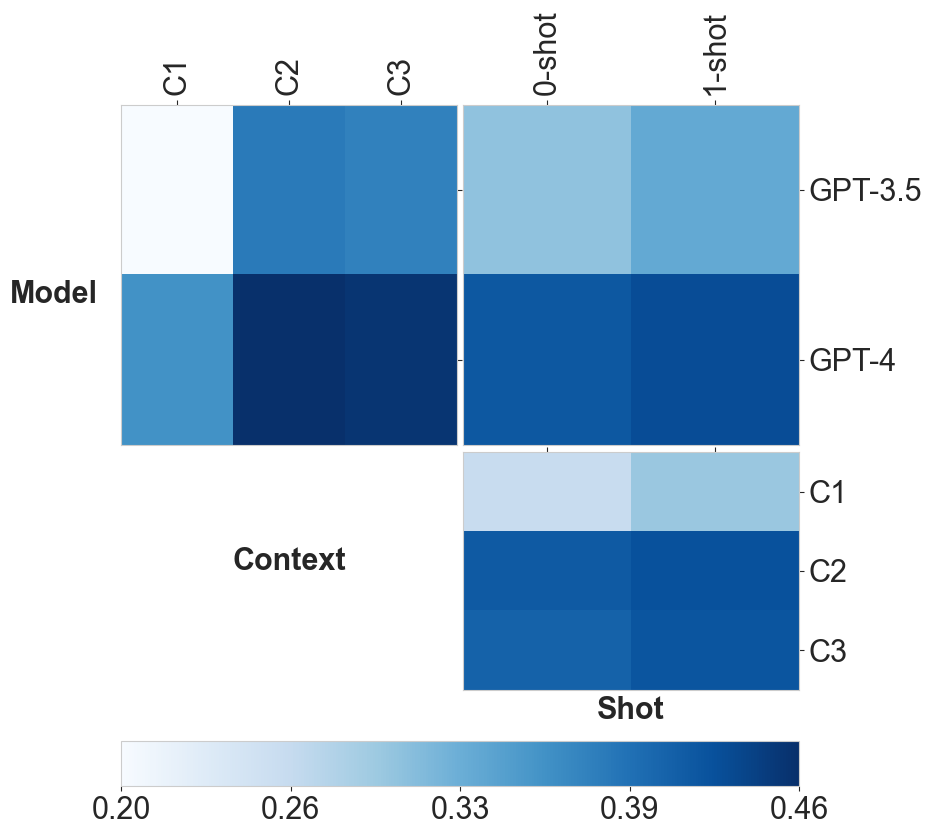
Analysis
# Join with labeling statisticslabelers_df = pd.concat([labeler_info, labeler_statistics, labeler_perf], axis=1)
✅ Saved figure to /Users/jonas-mika/epfl/coursework/projects/ml-project-2-mlp/report/figures/labeler-grid.pdf
Labeling Quality: Annotator agreeement between GPT and Human
We have seen in the preprocesssing notebook that the inter annotator agreement per website on average between humans measured via Cohen’s Kappa was already relatively low (\(0.2\)). In this section, we therefore focus on measuring the agreement level between the GPT labelers and the human annotators.
gpt_human_agg =dict()human_labels = np.array([v["labels"] for v in human_labeler.get_labels().values()])for name, labeler in gpt_labelers.items():# Obtain 2d array with labels for each website (n_websites, n_categories) gpt_labels = np.array([v["labels"] for v in labeler.get_labels().values()]) k = gpt_labels.shape[1]# Ensure matching between human and gpt labels human_labs_matched, gpt_labs_matched = match_labels(human_labeler, labeler) kappa_scores = []for j inrange(k):# Obtain the labels for kth class by human and gpt human_kthcls_labels = human_labs_matched[:, j] gpt_kthcls_labels = gpt_labs_matched[:, j]# Compute the cohens kappa score kappa = cohen_kappa_score(human_kthcls_labels, gpt_kthcls_labels)# Append to list kappa_scores.append(kappa)# Save the results gpt_human_agg[name] = kappa_scores
Let’s now evalute the results, first we look at the overall picture using dataframe:
We can see that as the complexity of the labeler increases, the more average agreement we obtain with the human annotators with plus or minus same standard deviation. Interestingly, we can see that for some categories and gpt4 based labelers we obtain almost \(0.5\) agreement.
Curlie
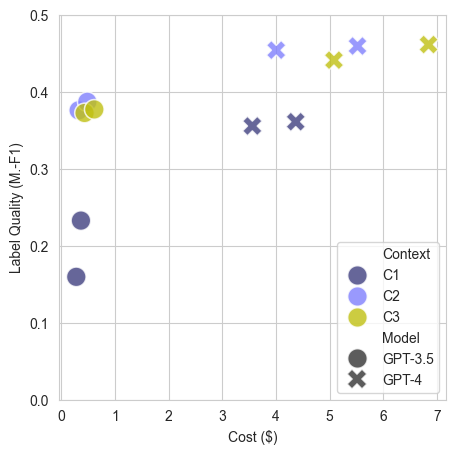
In this section we explore the labels of the curlie-1000 that we relabel with the most promising GPT labelers given the label quality and cost of labeling as shown in the section above.
# Initialise data and labeler configcurlie_cfg = hydra.compose(config_name="eda", overrides=["data=curlie"])curlie_labeler_names = ["gpt3.5-oneshot-context2", "gpt4-zeroshot-context2"]curlie_labeler_cfg = {name: hydra.compose(config_name="eda", overrides=[f"labeler={name}"]) for name in curlie_labeler_names}
# Instantiate datacurlie_data = hydra.utils.instantiate(curlie_cfg.data)curlie_labeler = {name: hydra.utils.instantiate(curlie_labeler.labeler, data=curlie_data) for name, curlie_labeler in curlie_labeler_cfg.items()}print(f"✅ Initialised {len(curlie_labeler)} labeler(s).")
✅ Initialised 2 labeler(s).
We expect that the LPP will be higher as the labelers have learned to replicate the human labels.
values = [get_statistics(labeler) for labeler in curlie_labeler.values()]index = [get_labeler_name(name) for name in curlie_labeler.keys()]labeler_statistics = pd.DataFrame(values, index=index)labeler_statistics
valid
invalid
lpp
durations
prompt_tokens
completion_tokens
estimated_cost
cost_per_1k_page
GPT-3.5 + 1-shot + C2
9190
0
1.60 ± 1.08
2.09 ± 1.04
470.16 ± 87.36
92.99 ± 3.85
6.029949
0.656142
GPT-4 + 0-shot + C2
9190
0
2.03 ± 0.97
7.80 ± 3.32
228.16 ± 87.36
106.16 ± 8.10
50.235890
5.466365
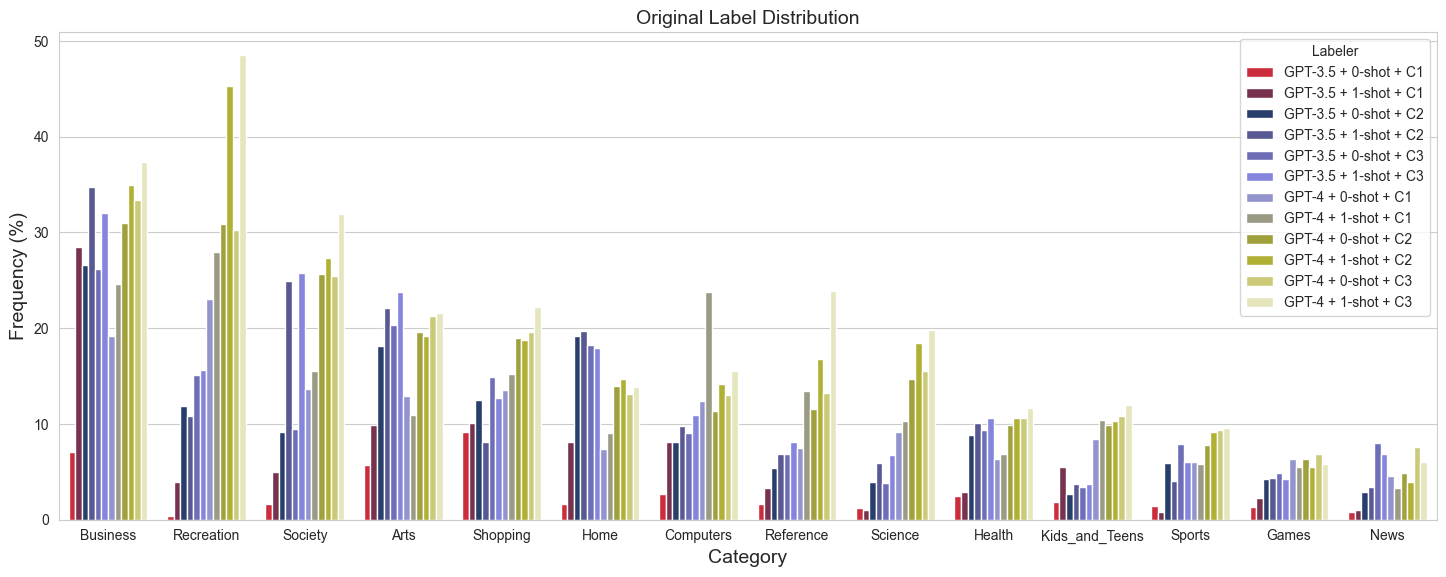
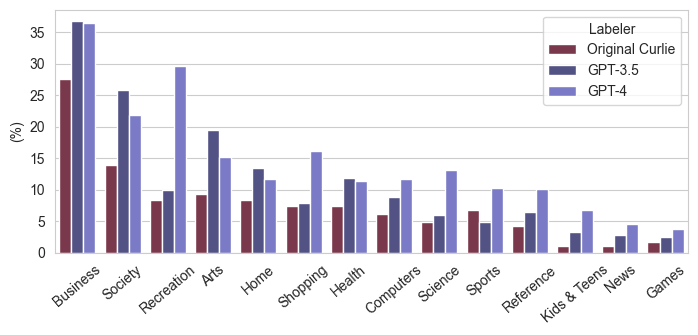
Let’s first look at the distribution of labels for each category.