%load_ext autoreload
%autoreload 2Preprocessing
From the authors of Homepage2Vec, we were given crowdsourced annotated data for roughly 800 homepages. Each homepage was labeled independently by three labelers. Our goal in this notebook to obtain a single label for each homepage.
Setup
import pandas as pd
import numpy as np
from sklearn.metrics import cohen_kappa_score

import os
import json

import matplotlib.pyplot as plt
import seaborn as sns

sns.set_style("whitegrid")
import bleach

import warnings

warnings.filterwarnings("ignore")

from ml_project_2_mlp import utilssns.set_style("dark")
sns.set_palette("gist_stern")Load Data
load_path = os.path.join("..", "data", "crowdsourced", "labeled.csv")
labeled = pd.read_csv(load_path)
idx2cat = {
"0": 'Arts',
"1": 'Business',
"2": 'Computers',
"3": 'Games',
"4": 'Health',
"5": 'Home',
"6": 'Kids_and_Teens',
"7": 'News',
"8": 'Recreation',
"9": 'Reference',
"10": 'Science',
"11": 'Shopping',
"12": 'Society',
"13": 'Sports'
}
cat2idx = {v : k for k, v in idx2cat.items()}Crowdsourced Data: Labeling Analysis
Let’s start with some basic EDA:
print(f"Task title: {labeled['Title'][0]}")
print(f"Task description: {labeled['Description'][0]}")
print(f"Task reward: {labeled['Reward'][0]}")
Task title: Select all categories that are relevant for the website (English websites)
Task description: Given a screenshot, title, and description of a website, select all the relevant categories.
Task reward: $0.10# Number of records per unique page
number_of_labels, count = np.unique(
labeled["Input.uid"].value_counts(), return_counts=True
)
for numlabels, c in zip(number_of_labels, count):
print(f"There are {c} websites each annotated by {numlabels} labelers")
# Show the unique responses for each question
answers = set()
for answer in labeled["Answer.taskAnswers"]:
parsed_answer = json.loads(answer)
answers.update([v for v in parsed_answer[0].values() if type(v) == str])
print(f"There are {len(answers)} unique responses: {answers}")
# Average number of labels per user
avg_user_labels = labeled["WorkerId"].value_counts().mean()
print(f"On average each labeler annotated {avg_user_labels} pages")There are 840 websites each annotated by 3 labelers
There are 3 unique responses: {'UNSURE', 'NO', 'YES'}
On average each labeler annotated 60.0 pages# Make sure that for all records, AssignmentStatus is Approved
assert (
len(labeled["AssignmentStatus"].unique()) == 1
and labeled["AssignmentStatus"].unique()[0] == "Approved"
), "AssignmentStatus is not Approved"
print("✅ All records have AssignmentStatus Approved")
# Confirm that all pages are assigned with at most 3 assignments
max_assignments, count = np.unique(labeled["MaxAssignments"], return_counts=True)
assert len(max_assignments) == 1 and max_assignments[0] == 3, "MaxAssignments is not 3"
print("✅ This checks with the max assignments allowed.")
# Get Double Check that the list in TaskAnswers is of length 1 always
answers = set()
total = 0
for answer in labeled["Answer.taskAnswers"]:
parsed_answer = json.loads(answer)
if len(parsed_answer) > 1:
total += 1
if total > 0:
print(f"❗️ There are {total} records with taskAnswers list length > 1")
else:
print("✅ All records has taskAnswers list length = 1")
# Check missing values for Input.url, Input.screenshot, Input.title, Input.description, report in percentage
for col in ["Input.url", "Input.screenshot", "Input.title", "Input.description"]:
miss_vals = labeled[col].isna().sum() / len(labeled) * 100
if miss_vals > 0:
print(f"❗️ {col} has {miss_vals:.2f}% missing values")✅ All records have AssignmentStatus Approved
✅ This checks with the max assignments allowed.
✅ All records has taskAnswers list length = 1
❗️ Input.title has 2.86% missing values
❗️ Input.description has 46.19% missing valuesNext, let’s one hot encode the column Answer.taskAnswers based on the dictionary that each row includes:
# Create a new column AnswersParsed
labeled["AnswersParsed"] = labeled["Answer.taskAnswers"].apply(
    lambda x: {
        k.split("-")[-1]: v for k, v in json.loads(x)[0].items() if type(v) == str
    }
)

# Obtain the selected Idx and corresponding categories
labeled["SelectedIdx"] = labeled["AnswersParsed"].apply(
    lambda x: [k for k, v in x.items() if v == "YES"]
)
labeled["SelectedCategories"] = labeled["SelectedIdx"].apply(
    lambda x: [idx2cat[idx] for idx in x]
)

# Now, let's one hot encode the selected categories
for cat in cat2idx:
    labeled[cat] = labeled["SelectedCategories"].apply(lambda x: 1 if cat in x else 0)

relevant_columns = ["Input.uid", "Input.url"] + list(cat2idx)
labeled = labeled[relevant_columns]
labeled.head()| Input.uid | Input.url | Arts | Business | Computers | Games | Health | Home | Kids_and_Teens | News | Recreation | Reference | Science | Shopping | Society | Sports | |
|---|---|---|---|---|---|---|---|---|---|---|---|---|---|---|---|---|
| 0 | 1161124 | www.pointlesssites.com | 0 | 0 | 1 | 1 | 0 | 1 | 1 | 0 | 1 | 0 | 0 | 0 | 0 | 0 |
| 1 | 1161124 | www.pointlesssites.com | 0 | 0 | 0 | 1 | 0 | 1 | 1 | 0 | 1 | 0 | 0 | 0 | 1 | 0 |
| 2 | 1161124 | www.pointlesssites.com | 1 | 0 | 1 | 0 | 0 | 0 | 0 | 0 | 1 | 0 | 0 | 0 | 0 | 0 |
| 3 | 1081241 | www.connecticutplastics.com | 0 | 1 | 1 | 0 | 1 | 0 | 0 | 0 | 0 | 0 | 1 | 0 | 0 | 0 |
| 4 | 1081241 | www.connecticutplastics.com | 0 | 0 | 0 | 0 | 1 | 0 | 0 | 0 | 0 | 0 | 0 | 0 | 0 | 0 |
Now, for each website and category, we want to look at the aggreement accross annotators.
website_ids = labeled["Input.uid"].unique()
aggrements = []
for wid in website_ids:
    # Get all the annotations for this website
    annotations = labeled[labeled["Input.uid"] == wid].iloc[:, 2:].to_numpy()

    # Pair the annotations
    kappas = []
    for i in range(len(annotations)):
        for j in range(i + 1, len(annotations)):
            kappas.append(cohen_kappa_score(annotations[i], annotations[j]))

    # Take the average of all the kappas
    avg_kappa = np.mean(kappas)

    # If nan, then set to 0
    if np.isnan(avg_kappa):
        avg_kappa = 0

    # Save the average kappa for this website
    aggrements.append([wid, avg_kappa])

# Turn into pandas dataframe
aggrements = pd.DataFrame(aggrements, columns=["Input.uid", "Aggrement"])

# Plot the distribution of aggrements
sns.histplot(aggrements["Aggrement"])
plt.title(
    "Distribution of Aggrements with mean = {:.2f}".format(
        aggrements["Aggrement"].mean()
    )
);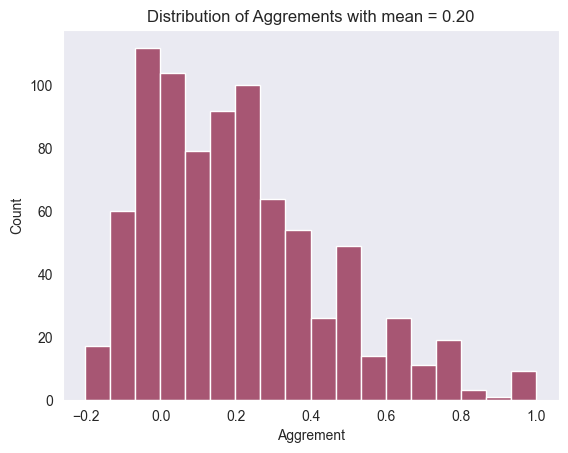
Let’s more accurate estimate of the mean using confidence intervals:
# Compute the mean and standard deviation of the aggrements
mean, std = aggrements["Aggrement"].mean(), aggrements["Aggrement"].std()

# Compute the 95% confidence interval
cf = 1.96 * std / np.sqrt(len(aggrements))
print(f"Mean (95% CI): {mean:.2f} ± {cf:.2f}")
Mean (95% CI): 0.20 ± 0.02Next, let’s use different aggregation strategies to obtain final labels for each webpage:
# Compute for each website the number of times the website was assigned given label
page_labc = labeled.groupby("Input.uid").sum()

# For each website, decided whether it belongs to the category or not based on the threshold = min. number of annotations
thresholds = [1, 2, 3]
thresholded = []
for t in thresholds:
    thresholded.append((page_labc.iloc[:, 1:] >= t).astype(int))

# Show the distribution of the number of categories per website
numlab_dist = [thresholded[t - 1].sum(axis=1) for t in thresholds]
print(
    f"For threshold = 1, the mean number of categories per website is {numlab_dist[0].mean():.2f}"
)
print(
    f"For threshold = 2, the mean number of categories per website is {numlab_dist[1].mean():.2f}"
)
print(
    f"For threshold = 3, the mean number of categories per website is {numlab_dist[2].mean():.2f}"
)

# Print the distribution of the number of categories per website
fig, axs = plt.subplots(1, 3, figsize=(15, 5))
for i, ax in enumerate(axs):
    sns.barplot(
        x=numlab_dist[i].value_counts().index,
        y=numlab_dist[i].value_counts().values / numlab_dist[i].shape[0],
        ax=ax,
        color="#31748f",
    )

# Add the labels
axs[0].set_title("Threshold = 1")
axs[1].set_title("Threshold = 2")
axs[2].set_title("Threshold = 3")

for ax in axs:
    ax.set_xlabel("Number of categories")
    ax.set_ylabel("Percentage")

# Add title
fig.suptitle("Distribution of the number of categories per website");
For threshold = 1, the mean number of categories per website is 7.66
For threshold = 2, the mean number of categories per website is 2.50
For threshold = 3, the mean number of categories per website is 0.54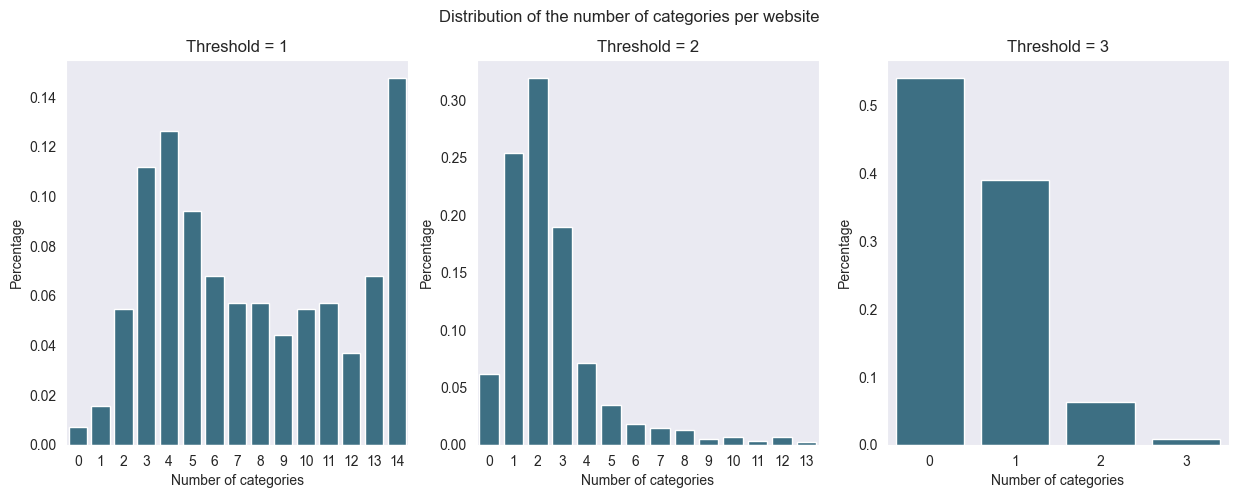
Given these results, having all three annotators agree on a label results in a very low number of labels per website. On the opposite site, having at least one annotator agree on a label results in a very high number of labels per website. Therefore, we will the at least 2 annotators agree on a label strategy which is likely the best trade-off between the two extremes. Let’s save the labels and websites obtained via this strategy to the corresponding folders:
wid_url = labeled[["Input.uid", "Input.url"]].drop_duplicates().rename({"Input.uid": "wid", "Input.url": "url"}, inplace=False, axis=1)

save_dir = os.path.join("..", "data", "raw")
save_path = os.path.join(save_dir, "crowdsourced.csv")
os.makedirs(save_dir, exist_ok=True)

wid_url.to_csv(save_path, index=False)
wid_url.head()| wid | url | |
|---|---|---|
| 0 | 1161124 | www.pointlesssites.com |
| 3 | 1081241 | www.connecticutplastics.com |
| 6 | 1162420 | 99percentinvisible.org |
| 9 | 1146040 | www.medicaid.gov |
| 12 | 1117243 | www.graalonline.com |
t2 = thresholded[1].reset_index().rename({"Input.uid": "wid"}, inplace=False, axis=1)
wid2labels = dict()
for _, row in t2.iterrows():
    wid2labels[str(row["wid"])] = {"labels": row.iloc[1:].to_list()}

save_dir = os.path.join("../data/labels/human")
save_path = os.path.join(save_dir, "crowdsourced.json")
os.makedirs(save_dir, exist_ok=True)

with open(save_path, "w") as f:
    json.dump(wid2labels, f)

keys = list(wid2labels.keys())
for k in keys[:5]:
    print(k, wid2labels[k])
125542 {'labels': [0, 1, 0, 0, 0, 0, 0, 0, 0, 1, 0, 0, 1, 0]}
246754 {'labels': [1, 0, 0, 0, 0, 0, 0, 0, 1, 0, 0, 0, 0, 0]}
290883 {'labels': [1, 0, 0, 0, 0, 0, 0, 0, 0, 0, 0, 0, 0, 0]}
312868 {'labels': [0, 0, 0, 0, 0, 0, 0, 0, 0, 0, 0, 0, 0, 0]}
382929 {'labels': [0, 1, 0, 0, 0, 0, 0, 0, 0, 0, 0, 0, 0, 0]}Further Exploration of the Preprocessed Data
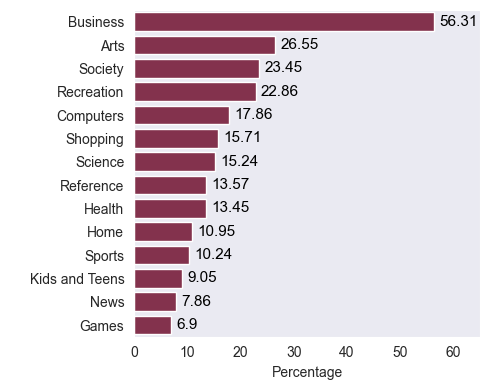
# Setup the figure
fig, axs = plt.subplots(figsize=(5, 4))
cats = t2.set_index("wid", inplace=False)

# Rename Kids_and_Teens to Kids and Teens
cats.rename({"Kids_and_Teens": "Kids and Teens"}, inplace=True, axis=1)

# Compute the percentage of each category
cat_per = (cats.sum(axis=0) / cats.shape[0] * 100).round(2).sort_values(ascending=False)

# Set labels
axs.set_xlabel("Percentage")
axs.set_ylabel(" ")

# To each bar assign the corresponding percentage
for i, v in enumerate(cat_per.values):
    axs.text(v + 1, i, f"{v}", color="black", va="center", fontsize=11)

# Set x-axis limits
axs.set_xlim([0, 65])

# Plot using seaborn
sns.barplot(y=cat_per.index, x=cat_per.values, ax=axs);

fig.tight_layout()

# Save the figure
save_path = os.path.join("..", "report", "figures", "category_distribution.png")
fig.savefig(save_path, bbox_inches="tight", dpi=300)